StudioKraft Creative Web Services, LLC
Web Analytics:
The Big Picture, A Small Investment
Web Analytics Tailored To Benefit Your Business
When running an online business or advertising campaign, you cannot afford to lose focus of what is working and what is wasting money.
If you are engaging in an online advertising campaign without some form of accompanying analytics program to give you a clear idea of how it is performing, you may be spending money on the wrong approach.
Knowing What Works
Our Analytics system is customized to your needs, whether you are running a PPC campaign to market your e-commerce store, or running a lead generation campaign for a brick and mortar business.
The foundation of our system is data collection, which can be performed directly on your server (best approach) or via the inclusion of a simple JavaScript code on your web site.
Once the data is collected, our reporting system allows for the definition of customized reports that filter, display and visualize the data in ways that make sense to you.
Customized Analytics Reports
Depending on the focus of your web site, the data collected by our analytics system may or may not be important to you. Rather than a one-size-fits-all approach, our SKAnalytics system can be customized to show the information that matters most for your business.
- Track PPC Ads - See what ads are sending visitors to your site, and which are converting visitors to sales.
- Detect click fraud and track who is doing it
- Identify competitors clicking on your ads, visiting your site, etc.
- Much More... detailed below
What SKAnalytics Can Show You
Our SKAnalytics system can be installed on any web site that we host, or can be added to any web site with a simple JavaScript. (Some features may not be available with the JavaScript Version.) The system continuously collects data about the visitors to your web site, and how your web site is performing in the search engines, both through PPC and organic results.
The intuitive interface of SKAnalytics allows you to examine the data and visualize it in many ways. Reports can be pulled for specified date ranges, and further filtered through specified criteria. Data can be stored for comparison to other data sets, and can be visualized using our built-in graphs.
The following are examples of some of the possibilities of SKAnalytics:
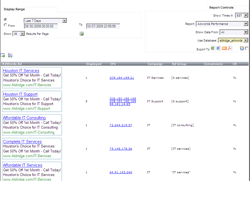
PPC Performance
The PPC Performance report tracks the effectiveness of PPC ads, by displaying which ads were clicked, and which ads resulted in a conversion.
This report is a tool to be used when managing a PPC campaign, as it can show which ads require optimization or deletion, which campaigns are performing, and allows a cross-reference to the data provided by the PPC company.
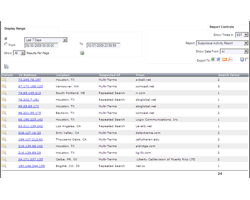
Suspicious Activity
The Suspicious Activity report analyzes visitor patterns and flags users who appear to be suspicious.
The report will display visitors who click on PPC ads multiple times (possible click fraud), visitors from known competitors, visitors who arrive at your site by using multiple search terms, visitors who seem to be "crawling" your web site, and more.
Armed with this information, users can be blocked from viewing your ads or accessing your site, and PPC companies can be notified of fraudulent activities.
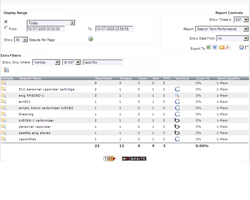
Search Term Performance
A Search Term Performance report can display the search terms and phrases used to access your web site, what page the user landed on after searching, and what search engine was used.
This report enables you to see which search terms result in the best performance (conversion, sale, lead) and which terms require further optimization.
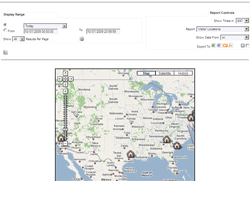
Visitor Location
The Visitor Location report visually displays the geographic location of the visitors to your web site, and can display different icons on the map for visitors who "converted".
Extremely useful for managing online advertising campaigns which are geo-targeted, as it displays where visitors to the site arrived from. Anomalies can be identified and proper actions taken based on the results displayed in this report.
This is a small example of the possibilites of the SKAnanlytics system. Reports can be customized depending on the application, and the report system itself can be utilized for other data visualization projects.
 Testimonial:
"Extremely professional, reliable, and provided timely service. I would [use them] again based on the quality of work I received."
K. Bethea